Building a data strategy in 2016
Vicki Boykis | CapTech | @vboykis

About CapTech
![]()
About me

The data landscape in 2006
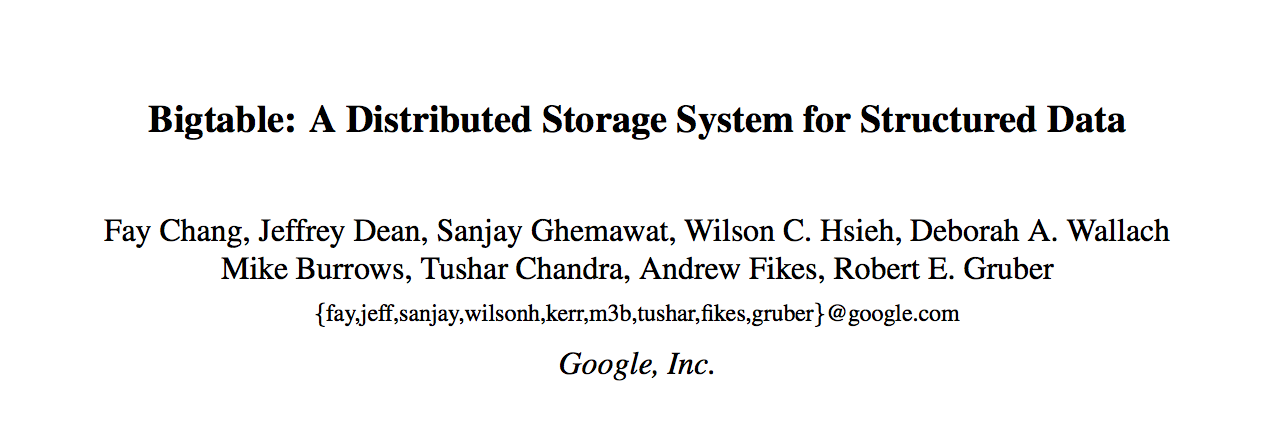
The data landscape today
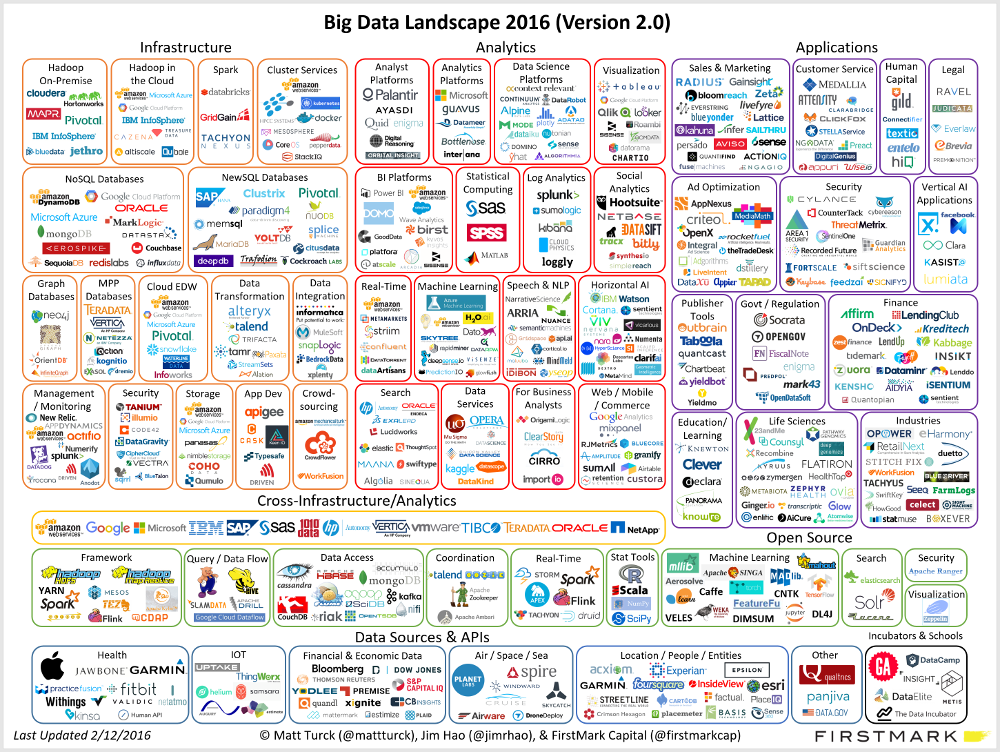
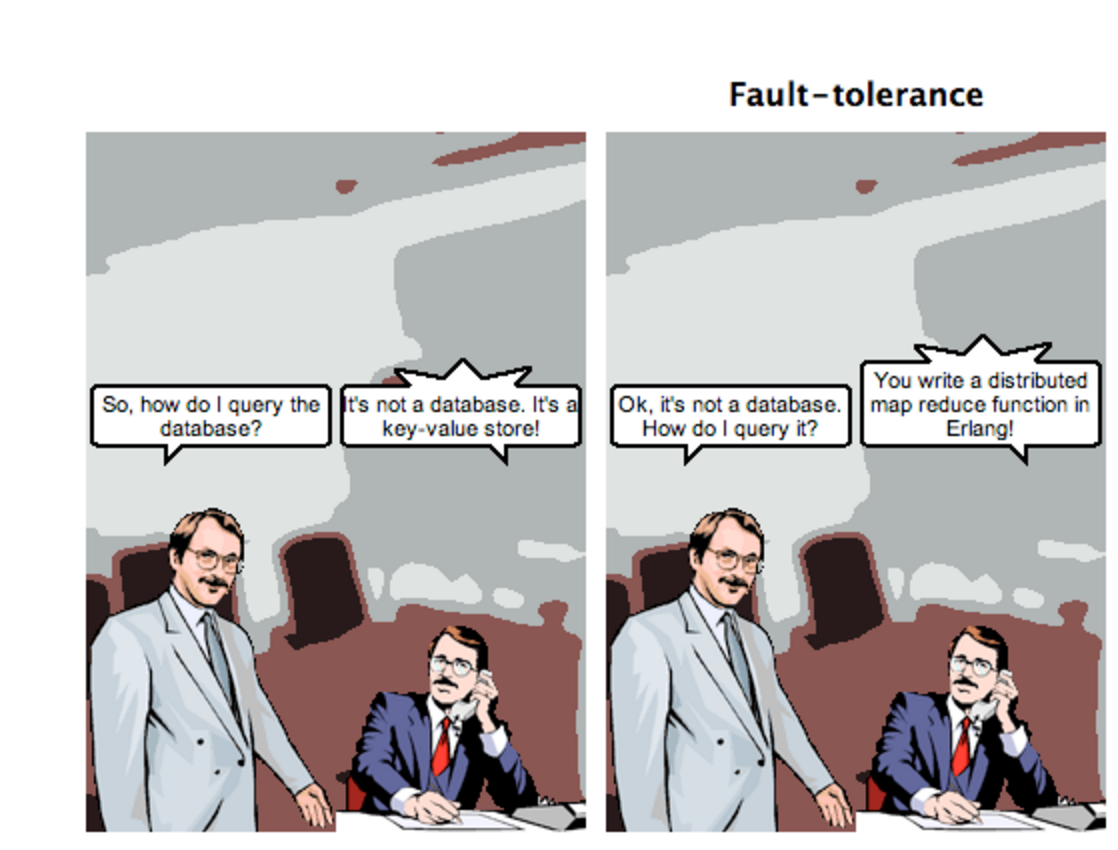
Now that we have all this cool stuff, how do we use it?
Agenda

- The basic rules of data
- Picking the right tool
- Common architecture patterns today
Basic rules of data

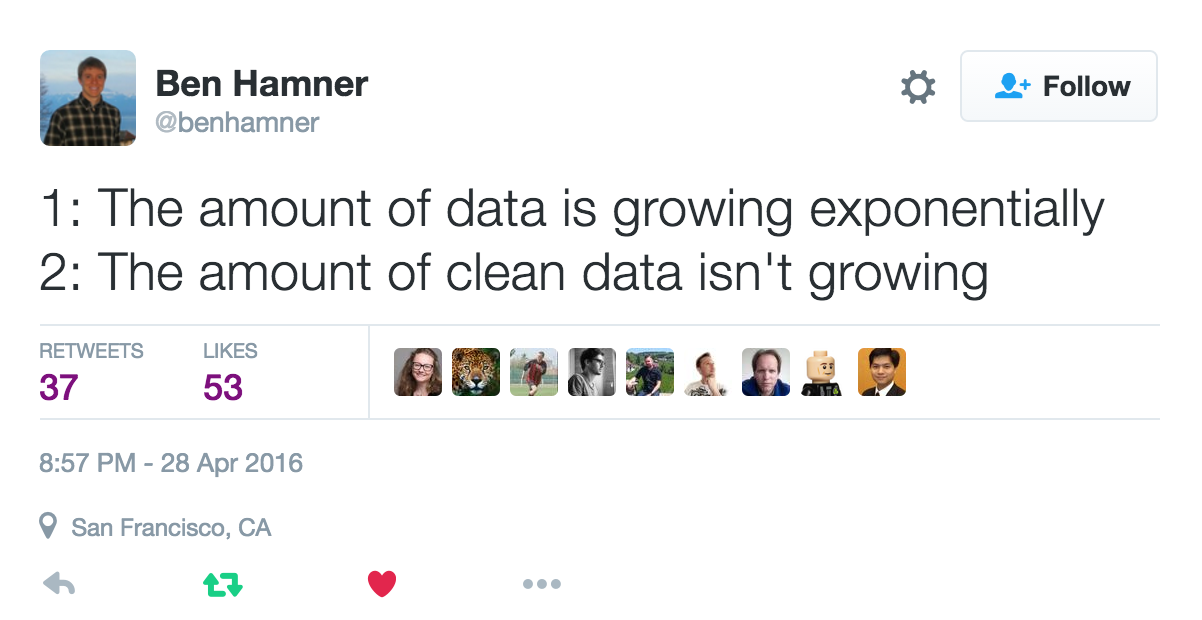
Data rule #1: Law of entropy
Natural processes have a preferred progress towards chaos
Goal: "I want to know how many customers I have."
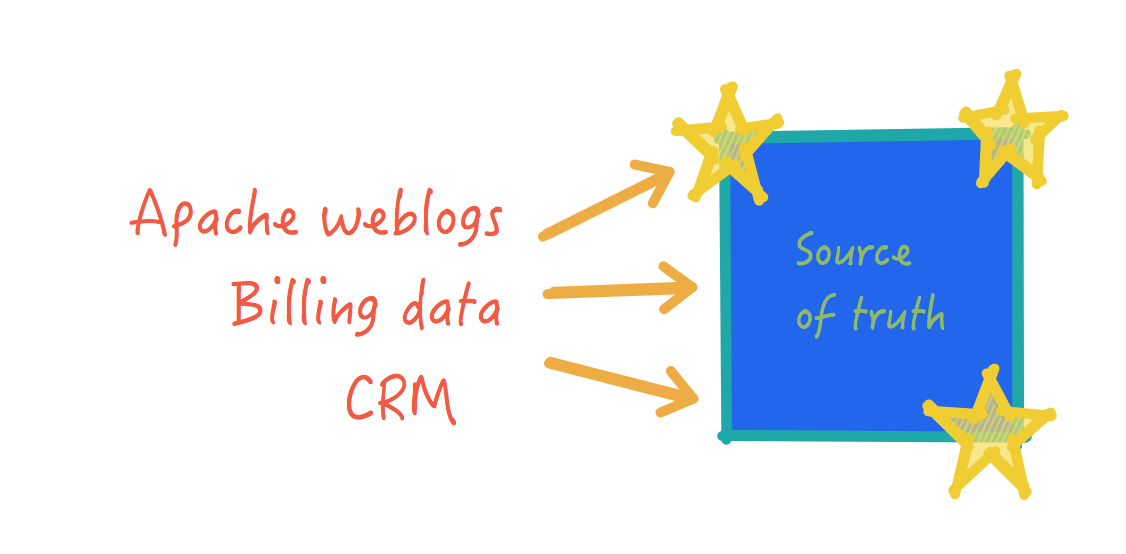
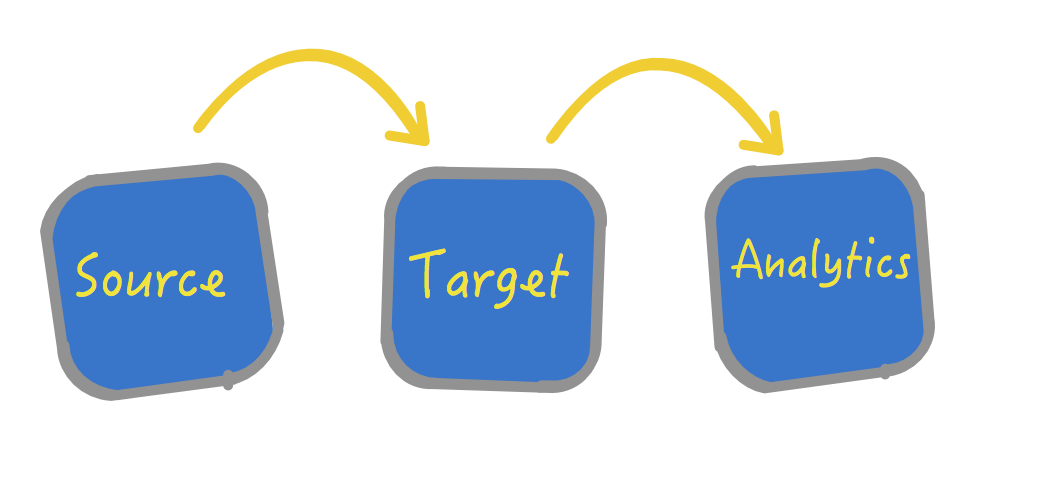
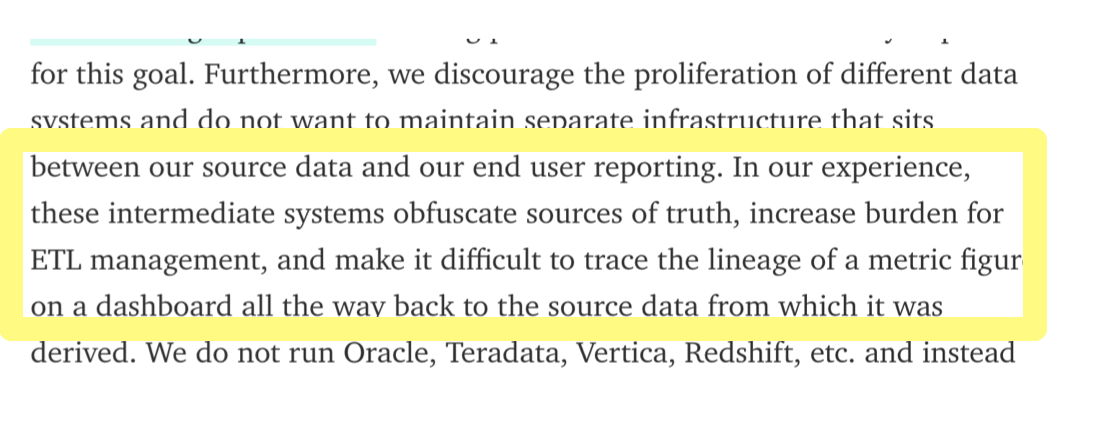
Data Rule #1a: Vicki's Rule of Data
The further away from source your data is, the more annoying it gets to query and manage
Result
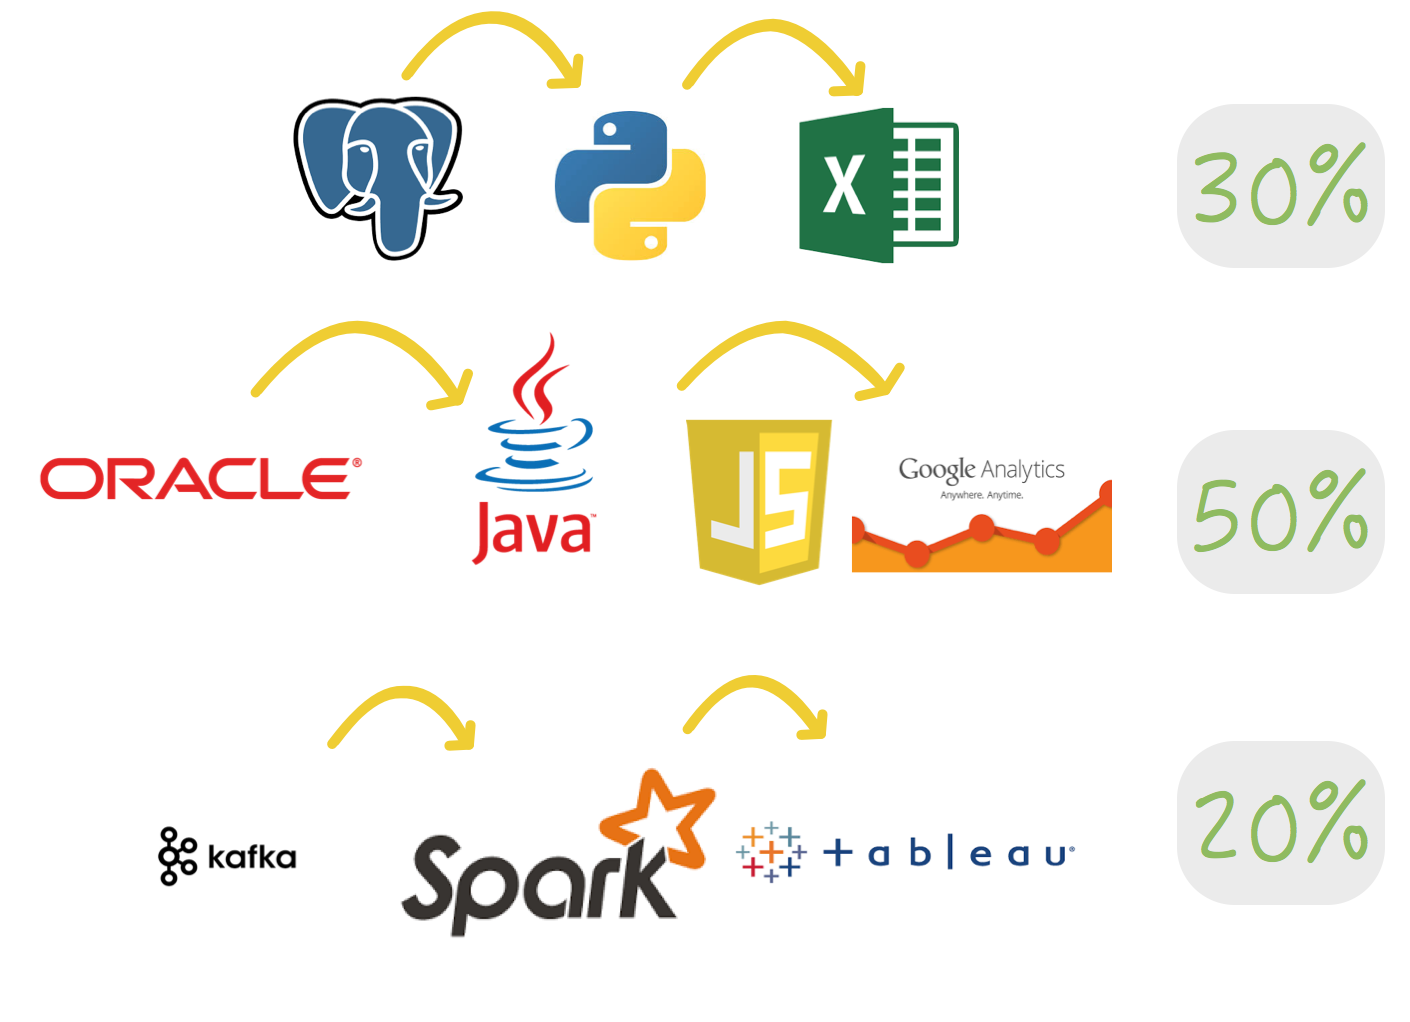
Data Rule #2: Pareto Rule
People use 20% of their tools 80% of the time because people stick to what they know.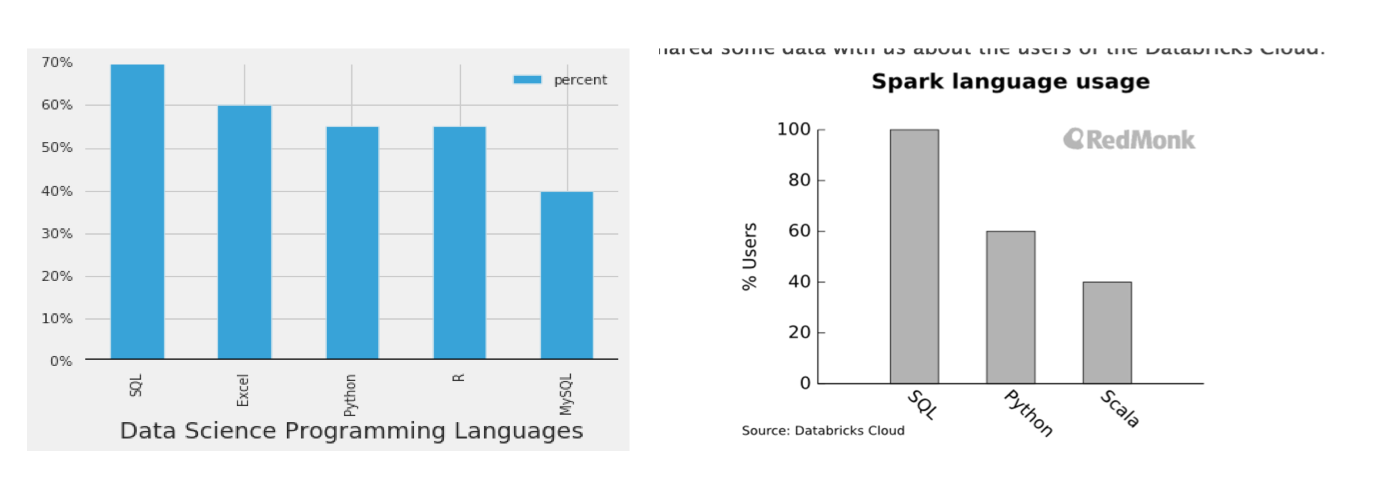
From the Data Science Salary Survey 2015
and The emergence of Spark.Data Rule #3: Conway's Law
Organizations which design systems ... are constrained to produce designs which are copies of the communication structures of these organizations
How to evaluate data tools

Q1: Do you have enough data for Big Data?
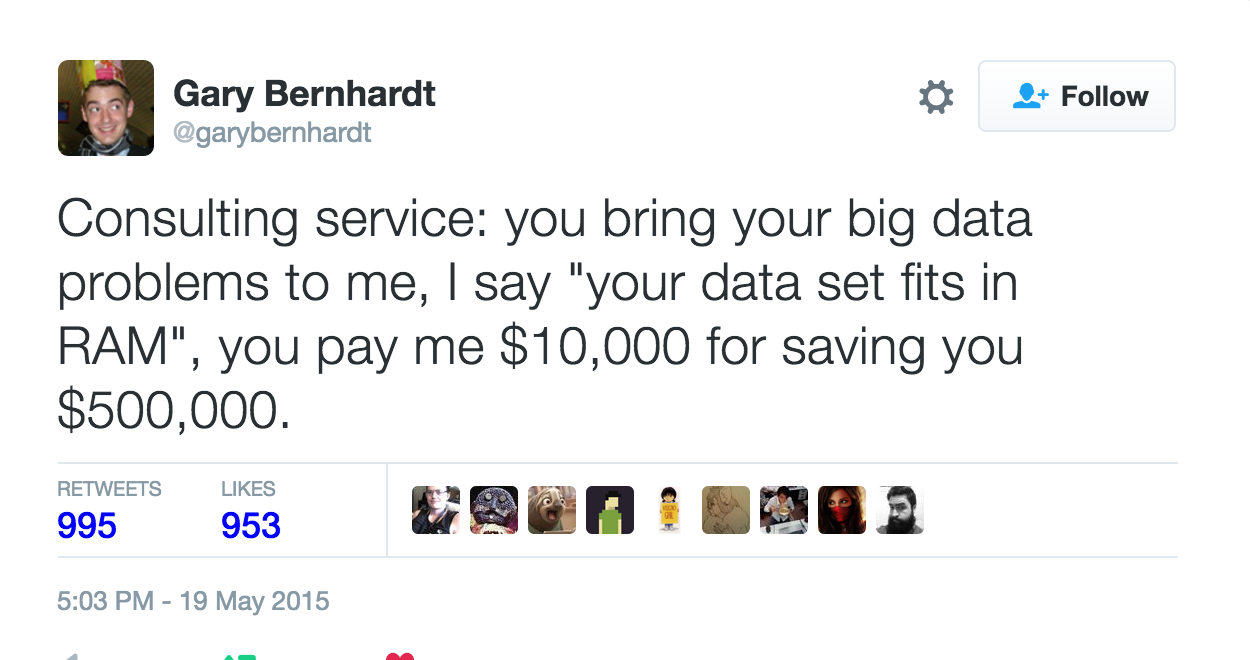
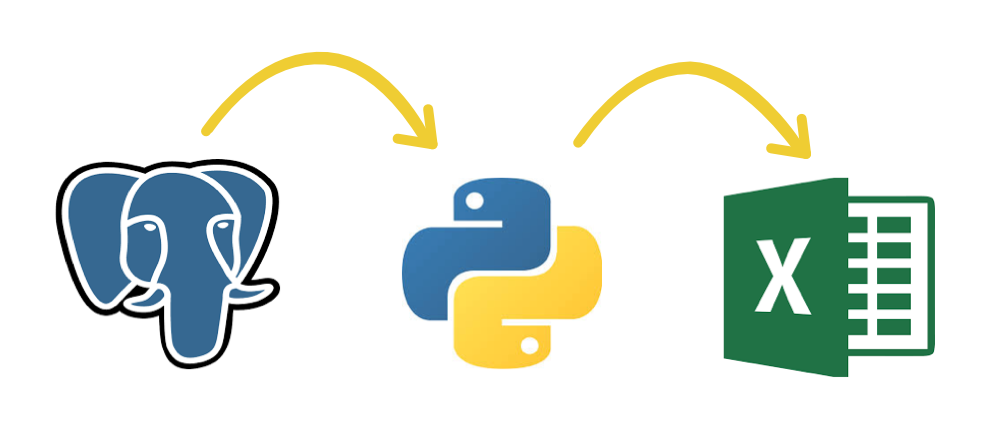
If you don't have big data, here's what your stack looks like:
Q2: What kind of data do you have?
- Slow/fast : stock trading v.s. home insurance
- Relational/ non-relational: banking transactions v.s. Wikipedia
- Is your data special? : Are you stargazing?
Q3: Who is going to be working with your data?
- Engineers - Documentation? APIs? Testing?
- Analysts - Access? Lineage?
- Decision-makers - Data meaning?
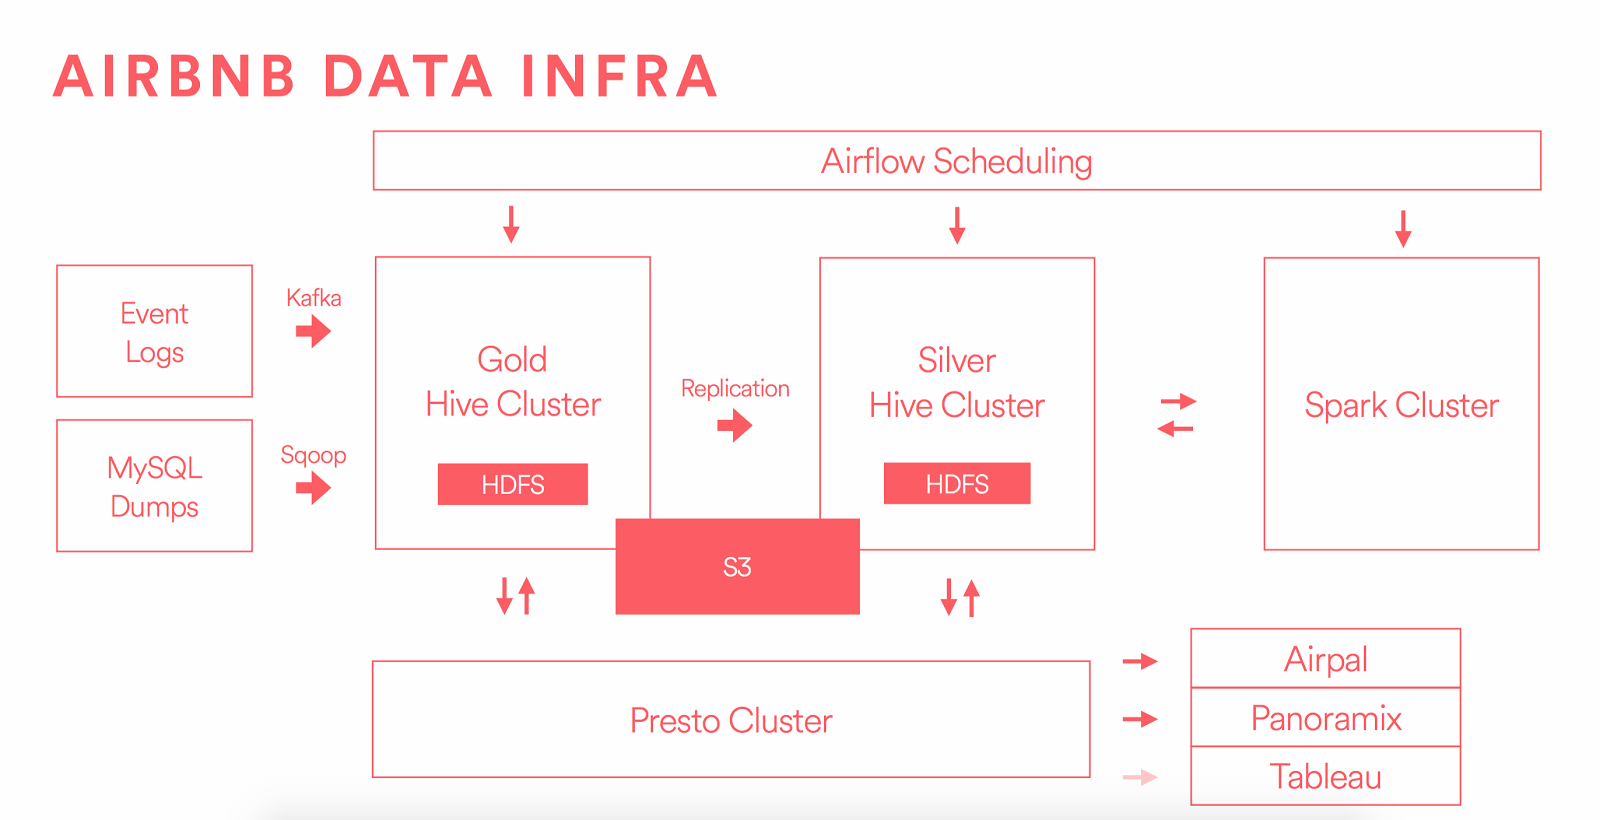
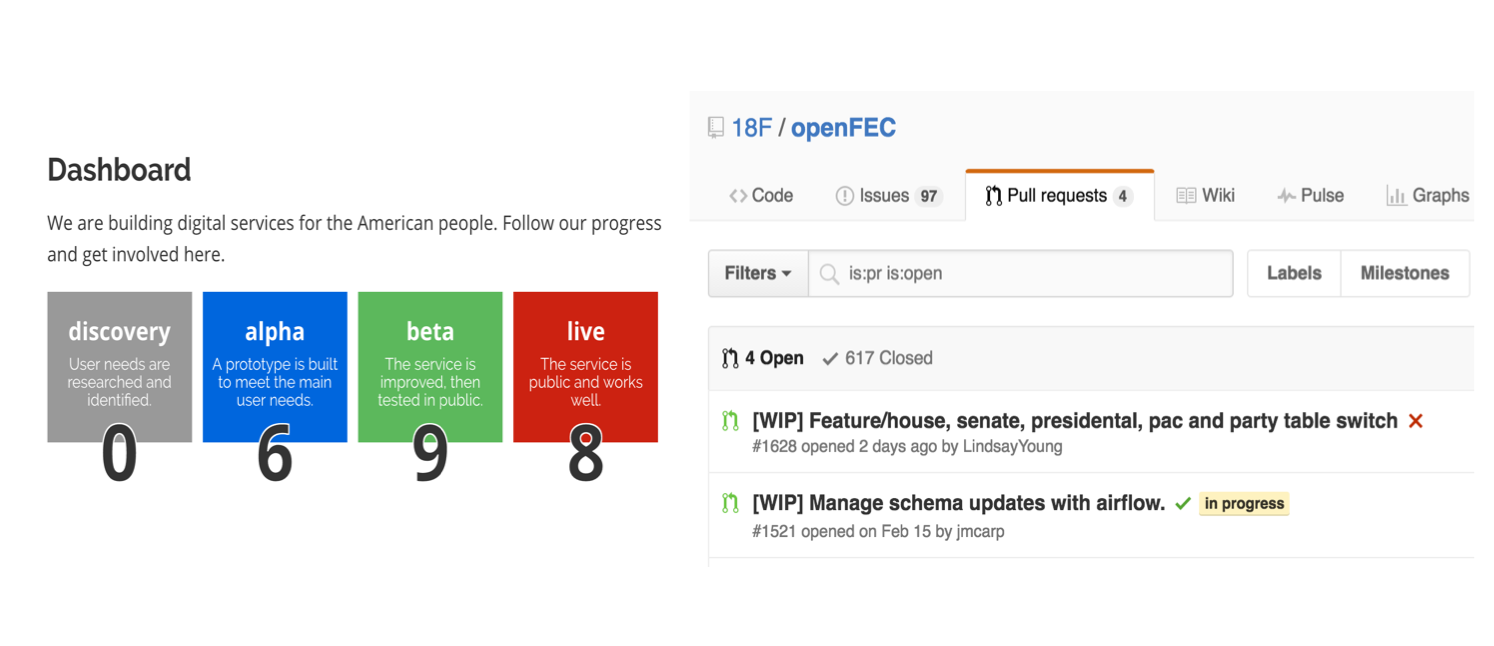
Common architecture today
New data trends

| Infrastructure | Analysis | Visualization |
|---|---|---|
| Kafka | Tensor Flow | Caravel |
| Feather | Bayesian Query Language | Jupyter Dashboards |
Thanks! Questions?
For more, check out my data post.